Financial Indices [Consolidated]
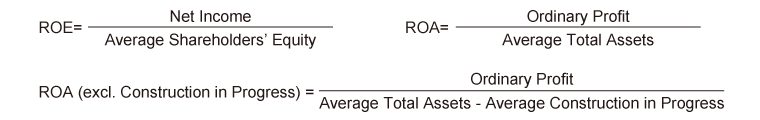
ROE/ROA/ROA (excl. Construction in Progress)
- * Net Income (Profit Attributable to owners of parent)
Per Share
- (Note)Amounts less than 1 yen have been rounded down.
Consolidated Financial Indices
|
2019/3 |
2020/3 |
2021/3 |
2022/3 |
2023/3 |
| Return on Equity(ROE) (%) |
5.8 |
5.3 |
2.8 |
8.1 |
11.4 |
| Return on Assets(ROA) (%) |
2.5 |
2.8 |
2.2 |
2.5 |
5.3 |
| ROA(excl. Construction in Progress) (%) |
3.2 |
3.6 |
2.8 |
3.1 |
6.6 |
| Earning per Share (EPS) (Yen) |
252.68 |
230.96 |
121.85 |
380.70 |
621.50 |
| Net Assets per Share(BPS) (Yen) |
4,356.54 |
4,412.84 |
4,420.39 |
5,004.31 |
5,931.68 |
| Prince Earning Ratio(PER) (Times) |
10.7 |
9.4 |
15.9 |
4.6 |
3.4 |
| Price Book-Value Ratio(PBR) (Times) |
0.6 |
0.5 |
0.4 |
0.3 |
0.4 |
| Interest Coverage Ratio (Times)*1 |
5.7 |
6.2 |
7.3 |
6.0 |
5.9 |
| D/E Ratio (Times)*2 |
2.1 |
2.0 |
2.1 |
2.0 |
1.7 |
- *1Interest Coverage Ratio = Operating CF / Interest Paid
- *2D/E Ratio = Interest-Bearing Debt / Shareholders' Equity